BRAD Customer Portal
Introduction – Getting Started
Welcome to B.R.A.D – Our Customer Portal
‘B.R.A.D’ stands for ‘Bywaters’ Reporting Analytics and Dashboards’.
-
The ‘Reporting’ segment relates to fixed reports that are tied to either events or time;
-
The ‘Analytics’ are flexible, self-service reports that allow users to explore and drill down into specific data;
The ‘Dashboards’ are highly intuitive snapshots of analysed data designed to be understood immediately by any user.
The advantage of allowing the consumer to segregate their recyclable wastes from their residual wastes at source, by using a two-bin system, is that this methodology provides a higher quality/value end material – which can be sorted for onward distribution and recycling on which BRAD provides an analytical perspective.
BRAD includes reports and dashboards that meet the diverse information needs and technical abilities of a wide range of roles in its internal and consumer bases.
Within the B.R.A.D Customer Portal there are currently six main areas.
- Job Lists
- Material Dashboard
- Financial Dashboard
- Monthly Collections Map
- Reports
- BRAD Analyser
Job List
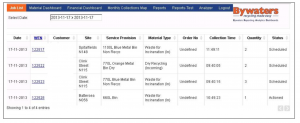
Displayed Jobs detailed information; the default displayed to the current day, but you can filter to past information.
-
-
-
-
-
-
-
-
- The date of the job or work
- The Job Number
- Customer Name
- Site Details
- Service Provision, Container Types
- Material Type, Waste description
- Order No – Customer Purchase Number
- Collection Time
- QTT
- Status
- Scheduled
- Action
-
-
-
-
-
-
-
Material Dashboard
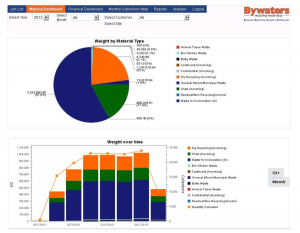
The Material Dashboard provides users with a visual analytical view of their Material types by Weight and Quantity, represented in the top pie chart. The bottom bar chart illustrates a trend analysis of the same values over time.
The detailed displayed can be can manipulated and aggregated by Year, Month, Customer, Individual site (if they exist) and by trend (quarter or month). Additionally, users can change the Materials displayed by clicking on the Materials Names.
Financial Dashboard
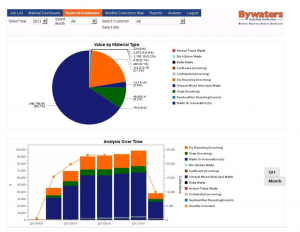
The Financial Dashboard provides users with a similar visual analytical view as the Materials Dashboard. The only difference between the values displayed is Invoiced Value. The top pie chart represents value by Material Type and the bottom bar chart, a trend analysis of the Value over Time.
The detailed displayed can again be manipulated and aggregated by Year, Month, Customer, Individual Site (if they exist). Trends can be shown by quarter or month. Users can change the Materials displayed by clicking on the Material Names.
Monthly Collection Map
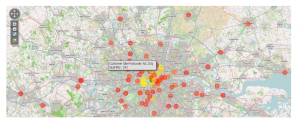
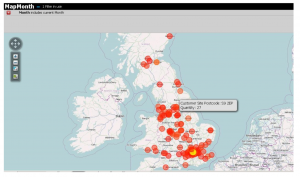
The Monthly Geo Collections map is a representation of a customer’s collections with the details displayed over a map to provide a visualisation of the demographics. Quantity and Material Types are examples of data that is visible. In this particular representation of details the gradient of a more pronounced colour indicates greater number of collections within the selected month. By hovering your cursor or mouse pointer over a circle will display further details.
Self Service Reports
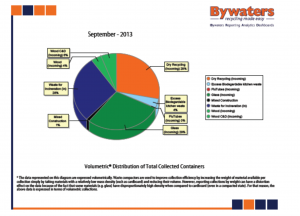
Provides customers with a tool to generate their own monthly reports. The customer is able to review performance over the month and compare to previous month.
BRAD Analyser
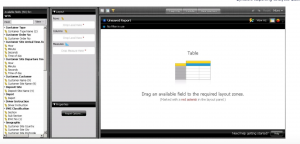
BRAD Analyser allows you to explore your data dynamically. You can drill down into the data to discover hidden details that may help you make important business decisions. The Analyser also presents data multi-dimensionally and lets you select what Dimensions and measures you want to explore.
BRAD Analyser is an interactive analysis tool and provides you with a drag-and-drop user interface that makes it easy for you to create reports quickly.
What’s an analyser report?
An analyser report is a collection of fields and filters that is displayed in a specific report format. You can think of a report as a file (like an Excel file), except that when you open a report or make a change, the report connects to your database so it displays the latest data. Reports are stored in the centre solution repository, so you can access reports from any computer.
When you create a new analyser report from the ground up, you select a cube first. This choice determines which fields will be available when you build your report. For example, if you choose orders as your analysis area, you most likely will see all fields related to orders.
Where does the data come from?
BRAD Data Integration can load data from applications, databases, and spread sheets within Bywaters. Currently we have data from Isys but there is development under way for data from CRM and more.
You can easily view the description of a specific field.
